COMMON ELEMENTS SCREEN
The following figure shows the elements common to all the “Monitor & Control” screens, as well as all the “Settings” screens.
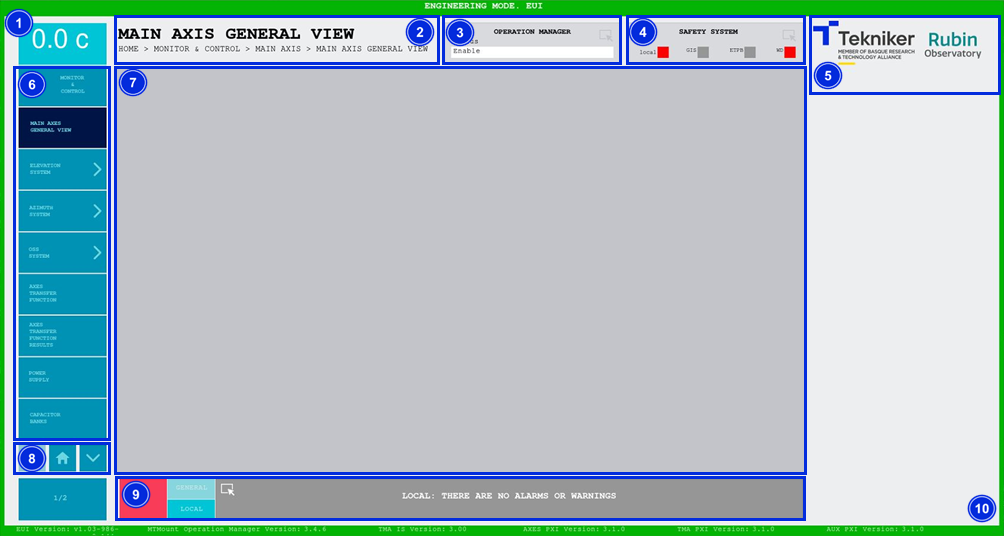
Figure 2‑10. Common elements screen.
| ITEM | DESCRIPTION |
|---|---|
| 1 | Displays the telescope temperature in real time. |
| 2 | Displays the title of the screen and its corresponding path | .
| 3 |
Accesses the screen “Operation Manager” Shows the statuses of the “Operation Manager”, ver |
| 4 |
Accesses the screen [Safety System](../02_Monitor&Control/034_SafetySystem.md) Shows four safety system signals:
|
| 5 | Tekniker and Rubin logos. |
| 6 |
Menu with access to screens, which changes depending on the window where the user is located. This section is hidden while a command is executed. |
| 7 | Space for monitoring and control windows. |
| 8 |
The arrows allow you to scroll up and down in the window menu. The centre softkey allows you to return to the [“Home”](./01_Home_Screen_Home.md) screen |
| 9 |
Accesses the screen [“Alarm History”](../02_Monitor%26Control/036_AlarmHistory.md) “GENERAL” softkey: accesses all alarms without filter. Softkey “LOCAL”: filters the alarms and with access only for those relating to the subsystem, if within a subsystem. |
| 10 | Mark on the screen, its colour changes depending on the operating mode, [see](./02_Change_Of_Operating_Mode.md) |
Statuses
There are multiple different statuses in the application, and all of them are accompanied by a representative color. This section explains the three most common ones with their respective colors:
Grey: Means that the system is off. This status is known as “Idle”.
Green: Means that the system is on. This system is called “Enable”.
Red: Means that the system has a fault. This status is given the name “Fault”, but it can also be accompanied by the name of the fault itself.